The Kraft record joins documented Trump access to separate legal and institutional outcomes. Kraft Group gave $1 million to Trump's 2017 inaugural committee; reporting later described Robert Kraft brokering direct access for Paul Weiss, and Trump appointed Kraft's wife Dana to the Kennedy Center board. Robert Kraft was charged with two misdemeanor solicitation counts; courts suppressed the surveillance and prosecutors dropped the charges, while four spa workers entered guilty pleas and one spent 60 days in custody. Kraft-controlled institutions separately accumulated NFL sanctions, environmental enforcement, a pollution class settlement and an app-privacy settlement. The record distinguishes personal charges, board service, entity sanctions, settlements and denied allegations; it does not convert company liability into a personal conviction or establish that Kraft's donation purchased Dana's appointment.
Donald J.
Trump
The receipts.
America First Audit Open person file
America First Audit
America First was the pitch. The cases below are dated, sourced and matched to who actually paid.
Open the audit Economic indicators below254 dated cases to
New case file
More cases
Latest in the chronology
Follow the money
What the public paid
$763.9MDocumented public costs and federal contract awards from the reviewed actions.
Projected, not yet spent$4.2TProjected deficit increase through 2034 · central scenario · through 2034-12-31- Reported public costs of reviewed activities$543,865,869
- Reported DHS advertising contract awards$220,000,000
How this total is built
- Calculation
- Add the two measures below. Each is already a subtotal of non-overlapping sourced observations in one currency.
- Included
- Documented federal, state, local or household costs attributable to identified presidential actions, plus the face value of the reported DHS advertising awards.
- Excluded
- Every force and conflict estimate, because those are competing models of the same campaigns rather than separate spending: the Pentagon and MilitarySpend Iran figures measure one operation, the Yemen range is two endpoints of one estimate, and the regional total spans two administrations. Also excludes projections, agency payments to Trump properties, which are counted in the other roll-up, and any measure that is not a dated observation in USD.
What reached Trump's businesses
$1.8BIncome disclosed by Trump-linked entities for 2025, plus public money paid to Trump properties.
- Overseas property licensing income, 2025$59,518,109As of 2026-06-30
- Revenue at five U.S. properties, 2025$307,105,604As of 2026-06-30
- Disclosed crypto business income, 2025$1,424,379,156As of 2026-06-30
How this total is built
- Calculation
- Add the three disclosed 2025 income measures below. The 2026 disclosure enumerates each entity once, so the three entity sets do not overlap.
- Included
- Reported 2025 income at the identified overseas licensing entities, the five named domestic properties, and the Trump-linked crypto entities.
- Excluded
- Asset values, unrealized appreciation, personal after-tax profit, and earlier annual snapshots. U.S. agency payments to Trump properties are reported separately below rather than added, because the reviewed payment sample may already sit inside the disclosed property revenue.
Presidential corruption ranking
Every administration since Eisenhower, scored out of 100. The black mark counts only what was proven — convictions, court rulings, inspector-general findings. The full score adds documented reporting. Scored by The Leah Files.
- 76
 Trump II2025-Trump II
- Score out of 100
- 76
- Proven only
- 69
- Scored by
- The Leah FilesPublished 2026-09-16
- 53Trump I2017-21Trump I
- Score out of 100
- 53
- Proven only
- Not scored separately
- Scored by
- The Leah FilesPublished 2026-09-16
- 41
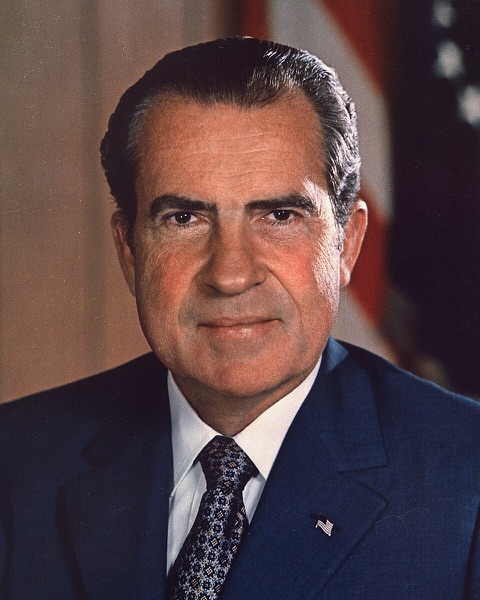 Nixon1969-74Nixon
- Score out of 100
- 41
- Proven only
- Not scored separately
- Scored by
- The Leah FilesPublished 2026-09-16
- 23
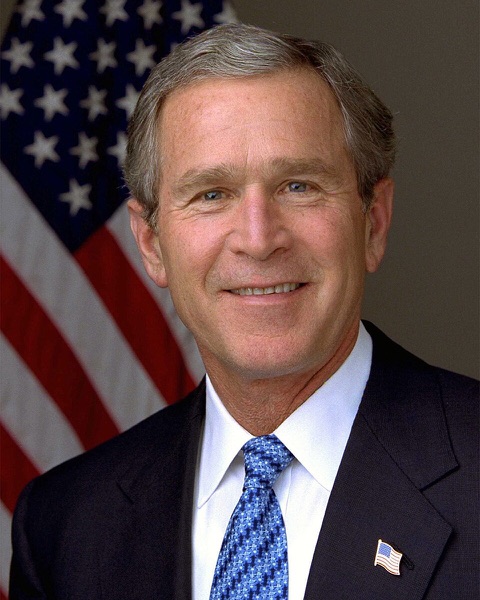 Bush 432001-09Bush 43
- Score out of 100
- 23
- Proven only
- Not scored separately
- Scored by
- The Leah FilesPublished 2026-09-16
- 22
 Clinton1993-2001Clinton
- Score out of 100
- 22
- Proven only
- Not scored separately
- Scored by
- The Leah FilesPublished 2026-09-16
- 21
 Reagan1981-89Reagan
- Score out of 100
- 21
- Proven only
- Not scored separately
- Scored by
- The Leah FilesPublished 2026-09-16
- 17
 Johnson1963-69Johnson
- Score out of 100
- 17
- Proven only
- Not scored separately
- Scored by
- The Leah FilesPublished 2026-09-16
- 13
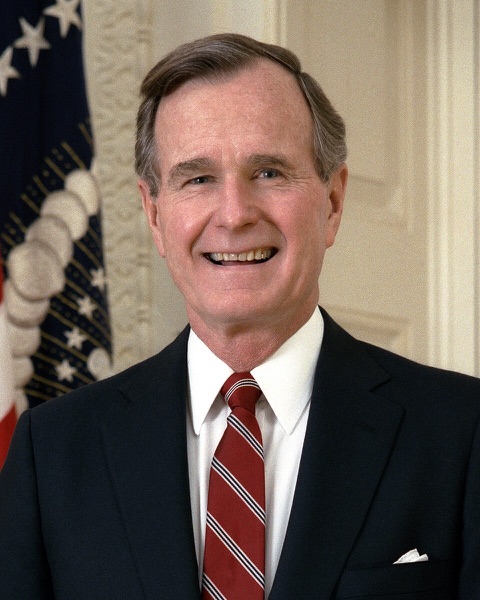 Bush 411989-93Bush 41
- Score out of 100
- 13
- Proven only
- Not scored separately
- Scored by
- The Leah FilesPublished 2026-09-16
- 10
 Kennedy1961-63Kennedy
- Score out of 100
- 10
- Proven only
- Not scored separately
- Scored by
- The Leah FilesPublished 2026-09-16
- 8
 Biden2021-25Biden
- Score out of 100
- 8
- Proven only
- Not scored separately
- Scored by
- The Leah FilesPublished 2026-09-16
- 8
 Obama2009-17Obama
- Score out of 100
- 8
- Proven only
- Not scored separately
- Scored by
- The Leah FilesPublished 2026-09-16
- 6
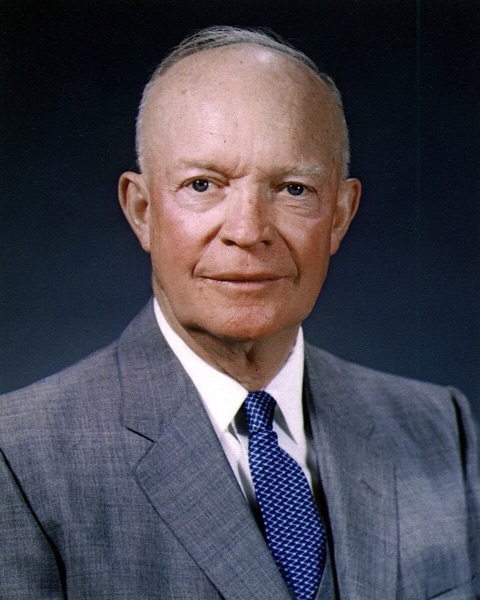 Eisenhower1953-61Eisenhower
- Score out of 100
- 6
- Proven only
- Not scored separately
- Scored by
- The Leah FilesPublished 2026-09-16
- 2
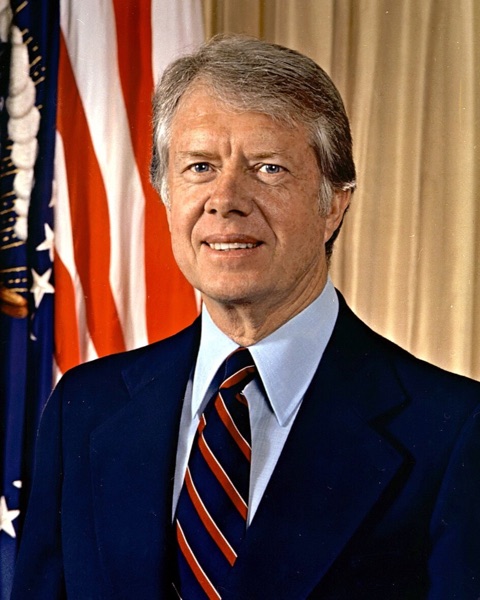 Carter1977-81Carter
- Score out of 100
- 2
- Proven only
- Not scored separately
- Scored by
- The Leah FilesPublished 2026-09-16
- 2
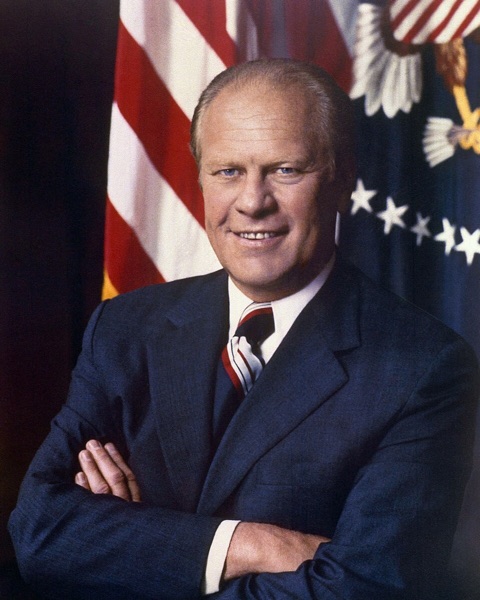 Ford1974-77Ford
- Score out of 100
- 2
- Proven only
- Not scored separately
- Scored by
- The Leah FilesPublished 2026-09-16
- Score out of 100
- Proven only
Exact counts
| Subject | Score out of 100 | Proven only |
|---|---|---|
| Trump II | 76 | 69 |
| Trump I | 53 | Not measured |
| Nixon | 41 | Not measured |
| Bush 43 | 23 | Not measured |
| Clinton | 22 | Not measured |
| Reagan | 21 | Not measured |
| Johnson | 17 | Not measured |
| Bush 41 | 13 | Not measured |
| Kennedy | 10 | Not measured |
| Biden | 8 | Not measured |
| Obama | 8 | Not measured |
| Eisenhower | 6 | Not measured |
| Carter | 2 | Not measured |
| Ford | 2 | Not measured |
Economic
conditions
He promised lower prices and cheaper borrowing. These are the published series.
America First AuditRed shading marks the stretch where a series moved the wrong way for the people it measures, against the baseline you choose.
Dates and comparisons
Comparisons use the last observation through each preceding December, not Inauguration Day. Latest dates vary by series. Historical values reflect the retrieved data, including revisions. Period comparisons do not establish causation.
Real weekly earnings
1982–84 dollars+4 1982–84 dollars from 374 on 2024-12-31
Median weekly pay adjusted for consumer prices. Higher values mean greater purchasing power for the median full-time worker.
Data, source & calculation
Original source observation, dated at period end. Source retrieval: 2026-10-12.
Seasonally adjusted. Changes in who is employed can change the median, particularly during the pandemic. Excludes self-employed workers.
U.S. Bureau of Labor Statistics via FRED
30-year mortgage rate
%+0.55 percentage points from 6.85% on 2024-12-26
The financing rate for a new fixed-rate mortgage, not the rate paid by every existing homeowner.
Data, source & calculation
Last available observation in each calendar month, including the latest partial month; not a monthly average. Source retrieval: 2026-10-12.
Not seasonally adjusted. Freddie Mac changed its survey methodology on November 17, 2022. Housing affordability also depends on prices, income, taxes and insurance.
Credit-card delinquency
%-0.23 percentage points from 3.08% on 2024-12-31
The share of bank credit-card loans that are delinquent, not the share of people behind on payments.
Data, source & calculation
Original source observation, dated at period end. Source retrieval: 2026-10-12.
Seasonally adjusted, end of period. This bank-loan series is not interchangeable with consumer-credit-panel delinquency rates.
Board of Governors of the Federal Reserve System via FRED
Unemployment rate
%+0.1 percentage points from 4.1% on 2024-12-31
People without work who are in the labor force. People outside the labor force are not counted as unemployed.
Data, source & calculation
Original source observation, dated at period end. Source retrieval: 2026-10-12.
Seasonally adjusted U-3 unemployment. Does not measure involuntary part-time work or everyone who has stopped looking for a job.
U.S. Bureau of Labor Statistics via FRED
Consumer price level
Index 1982–84 = 100+16.53 Index 1982–84 = 100 from 317.6 on 2024-12-31
The price level keeps accumulated increases visible even when inflation slows. Compare this with inflation-adjusted earnings, not nominal pay.
Data, source & calculation
Original source observation, dated at period end. Source retrieval: 2026-10-12.
Seasonally adjusted all-items CPI. A slower increase does not mean prices have returned to earlier levels.
U.S. Bureau of Labor Statistics via FRED
PCE inflation
%+0.77 percentage points from 2.65% on 2024-12-31
Change in consumer prices over twelve months. The Federal Reserve's longer-run inflation objective applies to this measure.
Federal Reserve longer-run objective: 2%
Data, source & calculation
100 × (current price index / index twelve months earlier − 1). Source retrieval: 2026-10-12.
Calculated from seasonally adjusted PCE price indexes. A longer-run target is not a month-by-month guarantee or a household-specific cost measure.
U.S. Bureau of Economic Analysis via FRED
Homebuying affordability
IndexAt 100, a median-income family has exactly the income needed to qualify under the source's mortgage assumptions. Lower values mean less buying capacity.
Income required to qualify under NAR assumptions: 100
Data, source & calculation
Original source observation, dated at period end. Source retrieval: 2026-10-12.
Assumes a 20% down payment. FRED carries only thirteen months under its source agreement, so earlier checkpoints are unavailable. Not seasonally adjusted.
National Association of Realtors via FRED
| Period end / date | Index | Evidence |
|---|---|---|
| 101.2 | Read record for 2025-08-31 | |
| 106.7 | Read record for 2025-09-30 | |
| 107.1 | Read record for 2025-10-31 | |
| 108.7 | Read record for 2025-11-30 | |
| 111 | Read record for 2025-12-31 | |
| 116.5 | Read record for 2026-01-31 | |
| 116.1 | Read record for 2026-02-28 | |
| 112 | Read record for 2026-03-31 | |
| 108 | Read record for 2026-04-30 | |
| 105.1 | Read record for 2026-05-31 | |
| 101.8 | Read record for 2026-06-30 | |
| 102.8 | Read record for 2026-07-31 | |
| 104.7 | Read record for 2026-08-31 |
Mortgage payment burden
%+0.14 percentage points from 5.69% on 2024-12-31
Required mortgage payments as a share of disposable income. Existing fixed-rate loans make this different from the cost facing a new buyer.
Data, source & calculation
Original source observation, dated at period end. Source retrieval: 2026-10-12.
Seasonally adjusted aggregate ratio, not the median homeowner's payment or a first-time buyer's affordability measure.
Board of Governors of the Federal Reserve System via FRED
Search the record
People in
the record
Open people files 





Legal record
Proceedings involving Trump or a Trump-linked entity; the stated period starts in 2000.
Executive action
Presidential actions, judicial outcomes, and documented public-cost estimates.
Reported DHS advertising contract awards
Projected deficit increase through 2034
Projected central · as of 2026-02-11 · through 2034-12-31Actions blocked or ruled unlawful
Reported public costs of reviewed activities
Modeled tariff cost per U.S. household
Projected central · as of 2026-09-02 · through 2026-12-31Clemency: money and restitution
Restitution is money a court orders a defendant to repay victims. The House figure includes repayment requests and money already paid, not just debt canceled by clemency. Lobbying fees and political donations are counted separately.
MO Strategies lobbying income, Q1 2026
As of 2026-05-24Reported clemency lobbying, 2025 (approx.)
As of 2026-03-12Herrera family donations in reviewed records
House report: restitution orders and requests
As of 2026-08-21Galanis: restitution ordered before clemency
As of 2025-06-11Force and civilian harm
Documented threats or uses of force, affected civilians and protected objects, and attributable public cost.
Threats to use armed force
States in reviewed threat records
As of 2020-04-22Threats of potentially prohibited conduct
Cross-border uses of force
Documented civilian-harm incidents
Documented civilian deaths
Documented civilian injuries
Protected-object incidents
Iran: MilitarySpend model, September 13, 2026
As of 2026-09-13Venezuela operations: estimated minimum, August 2025–March 2026
As of 2026-03-31Israel military aid: October 2023–September 2025
As of 2025-09-24Yemen and wider region: lower estimate, October 2023–September 2025
As of 2025-09-30Yemen and wider region: upper estimate, October 2023–September 2025
As of 2025-09-30Documented civilian deaths
CloseMinab school attack: Human Rights Watch calls for war-crime investigation
Human Rights Watch's March 7 investigation called the February 28 attack on Minab's Shajareh Tayyebeh Primary School unlawful and said it should be investigated as a war crime. Researcher Sophia Jones called for examining whether those responsible should have known the school was occupied. The report had not conclusively attributed the strike to the United States or Israel.
Airwars records civilian harm in Thaqban area, Bani al-Harith District
Airwars records at least 11 civilian deaths and at least 4 civilian injuries in Thaqban area, Bani al-Harith District on 2025-04-27; its dataset grades the civilian-harm evidence fair and US strike attribution likely or declared.
Airwars records civilian harm in 14th of October neighbourhood, Al Sab’een district, Sanaa
Airwars records at least 1 civilian deaths in 14th of October neighbourhood, Al Sab’een district, Sanaa on 2025-04-26; its dataset grades the civilian-harm evidence fair and US strike attribution likely or declared.
Airwars records civilian harm in Al-Nahda neighbourhood, Sanaa
Airwars records at least 2 civilian deaths and at least 2 civilian injuries in Al-Nahda neighbourhood, Sanaa on 2025-04-19; its dataset grades the civilian-harm evidence fair and US strike attribution likely or declared.
Airwars records civilian harm in Bani Matar
Airwars records at least 1 civilian deaths and at least 1 civilian injuries in Bani Matar on 2025-04-19; its dataset grades the civilian-harm evidence fair and US strike attribution likely or declared.
Airwars records civilian harm in Al-Nahda neighbourhood, Al-Thawra district, Sanaa
Airwars records at least 1 civilian deaths in Al-Nahda neighbourhood, Al-Thawra district, Sanaa on 2025-04-16; its dataset grades the civilian-harm evidence fair and US strike attribution likely or declared.
Airwars records civilian harm in Al-Sawari Ceramics Factory, Matnah, Bani Matar District
Airwars records at least 3 civilian deaths and at least 10 civilian injuries in Al-Sawari Ceramics Factory, Matnah, Bani Matar District on 2025-04-13; its dataset grades the civilian-harm evidence fair and US strike attribution likely or declared.
Airwars records civilian harm in Al-Nahda neighbourhood, Sanaa
Airwars records at least 1 civilian deaths in Al-Nahda neighbourhood, Sanaa on 2025-04-13; its dataset grades the civilian-harm evidence fair and US strike attribution likely or declared.
Airwars records civilian harm in Vicinity of Presidential House, Al-Sab’een district, Sanaa
Airwars records at least 2 civilian deaths and at least 1 civilian injuries in Vicinity of Presidential House, Al-Sab’een district, Sanaa on 2025-04-09; its dataset grades the civilian-harm evidence fair and US strike attribution likely or declared.
Airwars records civilian harm in Amin Muqbel, Al-Hawek district
Airwars records at least 13 civilian deaths and at least 10 civilian injuries in Amin Muqbel, Al-Hawek district on 2025-04-08; its dataset grades the civilian-harm evidence fair and US strike attribution likely or declared.
Airwars records civilian harm in Dhamar
Airwars records at least 1 civilian deaths and at least 3 civilian injuries in Dhamar on 2025-04-08; its dataset grades the civilian-harm evidence fair and US strike attribution likely or declared.
Trump's Yemen campaign left 153 civilians dead in three Pentagon-confirmed incidents
After interviews with 15 survivors and analysis of imagery, photos, and video, Amnesty International concluded the April 28 strike on the Sa'ada migrant detention center was indiscriminate and should be investigated as a war crime.
How this figure is calculated
519
- Calculation
- Sum non-overlapping documented civilian-death observations using each source's stated minimum, confirmed count, or range method.
- Included
- People classified as civilians under a disclosed source methodology, with incident, period, and uncertainty recorded.
- Excluded
- Combatants, missing persons counted as dead, overlapping monitoring datasets, and unbounded estimates.
- Displayed value
- Subtotal of the published observations, not a complete historical census.
HRW-reported minimum civilian deaths at Yakla
- Population
- Civilians HRW reported killed in the January 29, 2017 Yakla raid
- Period
- 2017-01-29 to 2017-01-29
- Method
- Use HRW's reported minimum of 14 civilians, including nine children, based on witness interviews. Exclude the separately reported AQAP fighters and US service member; do not add competing casualty estimates.
- Limitations
- Source-reported minimum, not a confirmed universal total. The US military described armed women at fighting positions, an account HRW could not confirm. Non-overlapping with the 2025 Rough Rider observations.
US-assessed Baghuz civilian deaths
- Population
- Civilians in the March 18, 2019 Baghuz strike, US review assessment
- Period
- 2019-03-18 to 2019-03-18
- Method
- US review's civilian classification and casualty breakdown, excluding enemy fighters. Existing inquiry and possible-war-crime observations are not repeated.
- Limitations
- Official assessment differs from earlier reporting. Preserve the separately attributed source assessment and the US review's contrary legal conclusion.
AFRICOM-revised El Burr civilian deaths
- Population
- April 1, 2018 El Burr, Somalia strike; revised AFRICOM assessment
- Period
- 2018-04-01 to 2018-04-01
- Method
- The FY2025 Q2 finding adds one previously unknown death to two earlier acknowledged deaths. One incident, counted once; no separate additional-death counter.
- Limitations
- More-likely-than-not official finding; identifying details withheld to protect surviving family. No injury value inferred from its omission.
Airwars minimum Minab civilian deaths
- Population
- People killed or injured in the February 28, 2026 Minab school strike, Airwars assessment reported by AP
- Period
- 2026-02-28 to 2026-02-28
- Method
- Uses Airwars' lower bound as reported in AP's forensic reconstruction; excludes overlapping Iranian official totals. The previously recorded possible-war-crime assessment is not counted again.
- Limitations
- Source-assessed US strike attribution; the US investigation had not publicly concluded in the reporting reviewed. Fatality estimates and injury ranges may be revised.
US-assessed Mosul civilian deaths
- Population
- Civilians killed in the March 17, 2017 Mosul strike and resulting explosion
- Period
- 2017-03-17 to 2017-03-17
- Method
- 101 civilians in the targeted building plus four in an adjacent structure, as assessed by the US investigation. The 36 unaccounted-for people are excluded.
- Limitations
- US assessment attributes the larger explosion to ISIS explosives; this numeric observation does not change the investigation's legal assessment.
Amnesty-assessed Somalia civilian deaths
- Population
- Five Lower Shabelle incidents investigated by Amnesty; source-assessed US attribution and civilian classification
- Period
- 2017-10-16 to 2018-12-09
- Method
- Amnesty's five-event aggregate; 65 witness/survivor interviews, imagery and corroboration. Distinct dates exclude El Burr April 2018 and official 2019–20 cases. No component counts are also added.
- Limitations
- US attribution at Illimey was assessed most plausible, not confirmed; AFRICOM disputed attribution there and civilian harm elsewhere. These remain attributed NGO findings.
Airwars minimum civilian deaths
- Population
- Civilians reported by Airwars in incident USYEM250315a
- Period
- 2025-03-15 to 2025-03-15
- Method
- Airwars incident minimum; fair civilian-harm evidence and likely/declared US attribution. Incident IDs deduplicate time and place. Excludes the three April 6, 17 and 28 incidents already represented by DoD observations. No operation count is added for this component of Rough Rider.
- Limitations
- Independent source assessment, not a US admission or legal finding. Local reporting may be incomplete; Airwars maintains live assessments and reported ranges. Missing death or injury values remain unmeasured.
Airwars minimum civilian deaths
- Population
- Civilians reported by Airwars in incident USYEM250315b
- Period
- 2025-03-15 to 2025-03-16
- Method
- Airwars incident minimum; fair civilian-harm evidence and likely/declared US attribution. Incident IDs deduplicate time and place. Excludes the three April 6, 17 and 28 incidents already represented by DoD observations. No operation count is added for this component of Rough Rider.
- Limitations
- Independent source assessment, not a US admission or legal finding. Local reporting may be incomplete; Airwars maintains live assessments and reported ranges. Missing death or injury values remain unmeasured.
Airwars minimum civilian deaths
- Population
- Civilians reported by Airwars in incident USYEM250316a
- Period
- 2025-03-16 to 2025-03-16
- Method
- Airwars incident minimum; fair civilian-harm evidence and likely/declared US attribution. Incident IDs deduplicate time and place. Excludes the three April 6, 17 and 28 incidents already represented by DoD observations. No operation count is added for this component of Rough Rider.
- Limitations
- Independent source assessment, not a US admission or legal finding. Local reporting may be incomplete; Airwars maintains live assessments and reported ranges. Missing death or injury values remain unmeasured.
Airwars minimum civilian deaths
- Population
- Civilians reported by Airwars in incident USYEM250323a
- Period
- 2025-03-23 to 2025-03-23
- Method
- Airwars incident minimum; fair civilian-harm evidence and likely/declared US attribution. Incident IDs deduplicate time and place. Excludes the three April 6, 17 and 28 incidents already represented by DoD observations. No operation count is added for this component of Rough Rider.
- Limitations
- Independent source assessment, not a US admission or legal finding. Local reporting may be incomplete; Airwars maintains live assessments and reported ranges. Missing death or injury values remain unmeasured.
Airwars minimum civilian deaths
- Population
- Civilians reported by Airwars in incident USYEM250326a
- Period
- 2025-03-26 to 2025-03-26
- Method
- Airwars incident minimum; fair civilian-harm evidence and likely/declared US attribution. Incident IDs deduplicate time and place. Excludes the three April 6, 17 and 28 incidents already represented by DoD observations. No operation count is added for this component of Rough Rider.
- Limitations
- Independent source assessment, not a US admission or legal finding. Local reporting may be incomplete; Airwars maintains live assessments and reported ranges. Missing death or injury values remain unmeasured.
Airwars minimum civilian deaths
- Population
- Civilians reported by Airwars in incident USYEM250328b
- Period
- 2025-03-28 to 2025-03-28
- Method
- Airwars incident minimum; fair civilian-harm evidence and likely/declared US attribution. Incident IDs deduplicate time and place. Excludes the three April 6, 17 and 28 incidents already represented by DoD observations. No operation count is added for this component of Rough Rider.
- Limitations
- Independent source assessment, not a US admission or legal finding. Local reporting may be incomplete; Airwars maintains live assessments and reported ranges. Missing death or injury values remain unmeasured.
Airwars minimum civilian deaths
- Population
- Civilians reported by Airwars in incident USYEM250330a
- Period
- 2025-03-30 to 2025-03-30
- Method
- Airwars incident minimum; fair civilian-harm evidence and likely/declared US attribution. Incident IDs deduplicate time and place. Excludes the three April 6, 17 and 28 incidents already represented by DoD observations. No operation count is added for this component of Rough Rider.
- Limitations
- Independent source assessment, not a US admission or legal finding. Local reporting may be incomplete; Airwars maintains live assessments and reported ranges. Missing death or injury values remain unmeasured.
Airwars minimum civilian deaths
- Population
- Civilians reported by Airwars in incident USYEM250330b
- Period
- 2025-03-30 to 2025-03-30
- Method
- Airwars incident minimum; fair civilian-harm evidence and likely/declared US attribution. Incident IDs deduplicate time and place. Excludes the three April 6, 17 and 28 incidents already represented by DoD observations. No operation count is added for this component of Rough Rider.
- Limitations
- Independent source assessment, not a US admission or legal finding. Local reporting may be incomplete; Airwars maintains live assessments and reported ranges. Missing death or injury values remain unmeasured.
Airwars minimum civilian deaths
- Population
- Civilians reported by Airwars in incident USYEM250401a
- Period
- 2025-04-01 to 2025-04-01
- Method
- Airwars incident minimum; fair civilian-harm evidence and likely/declared US attribution. Incident IDs deduplicate time and place. Excludes the three April 6, 17 and 28 incidents already represented by DoD observations. No operation count is added for this component of Rough Rider.
- Limitations
- Independent source assessment, not a US admission or legal finding. Local reporting may be incomplete; Airwars maintains live assessments and reported ranges. Missing death or injury values remain unmeasured.
Airwars minimum civilian deaths
- Population
- Civilians reported by Airwars in incident USYEM250403a
- Period
- 2025-04-03 to 2025-04-03
- Method
- Airwars incident minimum; fair civilian-harm evidence and likely/declared US attribution. Incident IDs deduplicate time and place. Excludes the three April 6, 17 and 28 incidents already represented by DoD observations. No operation count is added for this component of Rough Rider.
- Limitations
- Independent source assessment, not a US admission or legal finding. Local reporting may be incomplete; Airwars maintains live assessments and reported ranges. Missing death or injury values remain unmeasured.
Airwars minimum civilian deaths
- Population
- Civilians reported by Airwars in incident USYEM250405a
- Period
- 2025-04-05 to 2025-04-05
- Method
- Airwars incident minimum; fair civilian-harm evidence and likely/declared US attribution. Incident IDs deduplicate time and place. Excludes the three April 6, 17 and 28 incidents already represented by DoD observations. No operation count is added for this component of Rough Rider.
- Limitations
- Independent source assessment, not a US admission or legal finding. Local reporting may be incomplete; Airwars maintains live assessments and reported ranges. Missing death or injury values remain unmeasured.
Airwars minimum civilian deaths
- Population
- Civilians reported by Airwars in incident USYEM250408a
- Period
- 2025-04-08 to 2025-04-08
- Method
- Airwars incident minimum; fair civilian-harm evidence and likely/declared US attribution. Incident IDs deduplicate time and place. Excludes the three April 6, 17 and 28 incidents already represented by DoD observations. No operation count is added for this component of Rough Rider.
- Limitations
- Independent source assessment, not a US admission or legal finding. Local reporting may be incomplete; Airwars maintains live assessments and reported ranges. Missing death or injury values remain unmeasured.
Airwars minimum civilian deaths
- Population
- Civilians reported by Airwars in incident USYEM250408b
- Period
- 2025-04-08 to 2025-04-08
- Method
- Airwars incident minimum; fair civilian-harm evidence and likely/declared US attribution. Incident IDs deduplicate time and place. Excludes the three April 6, 17 and 28 incidents already represented by DoD observations. No operation count is added for this component of Rough Rider.
- Limitations
- Independent source assessment, not a US admission or legal finding. Local reporting may be incomplete; Airwars maintains live assessments and reported ranges. Missing death or injury values remain unmeasured.
Airwars minimum civilian deaths
- Population
- Civilians reported by Airwars in incident USYEM250409a
- Period
- 2025-04-09 to 2025-04-09
- Method
- Airwars incident minimum; fair civilian-harm evidence and likely/declared US attribution. Incident IDs deduplicate time and place. Excludes the three April 6, 17 and 28 incidents already represented by DoD observations. No operation count is added for this component of Rough Rider.
- Limitations
- Independent source assessment, not a US admission or legal finding. Local reporting may be incomplete; Airwars maintains live assessments and reported ranges. Missing death or injury values remain unmeasured.
Airwars minimum civilian deaths
- Population
- Civilians reported by Airwars in incident USYEM250413a
- Period
- 2025-04-13 to 2025-04-13
- Method
- Airwars incident minimum; fair civilian-harm evidence and likely/declared US attribution. Incident IDs deduplicate time and place. Excludes the three April 6, 17 and 28 incidents already represented by DoD observations. No operation count is added for this component of Rough Rider.
- Limitations
- Independent source assessment, not a US admission or legal finding. Local reporting may be incomplete; Airwars maintains live assessments and reported ranges. Missing death or injury values remain unmeasured.
Airwars minimum civilian deaths
- Population
- Civilians reported by Airwars in incident USYEM250413b
- Period
- 2025-04-13 to 2025-04-13
- Method
- Airwars incident minimum; fair civilian-harm evidence and likely/declared US attribution. Incident IDs deduplicate time and place. Excludes the three April 6, 17 and 28 incidents already represented by DoD observations. No operation count is added for this component of Rough Rider.
- Limitations
- Independent source assessment, not a US admission or legal finding. Local reporting may be incomplete; Airwars maintains live assessments and reported ranges. Missing death or injury values remain unmeasured.
Airwars minimum civilian deaths
- Population
- Civilians reported by Airwars in incident USYEM250416a
- Period
- 2025-04-16 to 2025-04-16
- Method
- Airwars incident minimum; fair civilian-harm evidence and likely/declared US attribution. Incident IDs deduplicate time and place. Excludes the three April 6, 17 and 28 incidents already represented by DoD observations. No operation count is added for this component of Rough Rider.
- Limitations
- Independent source assessment, not a US admission or legal finding. Local reporting may be incomplete; Airwars maintains live assessments and reported ranges. Missing death or injury values remain unmeasured.
Airwars minimum civilian deaths
- Population
- Civilians reported by Airwars in incident USYEM250419a
- Period
- 2025-04-19 to 2025-04-19
- Method
- Airwars incident minimum; fair civilian-harm evidence and likely/declared US attribution. Incident IDs deduplicate time and place. Excludes the three April 6, 17 and 28 incidents already represented by DoD observations. No operation count is added for this component of Rough Rider.
- Limitations
- Independent source assessment, not a US admission or legal finding. Local reporting may be incomplete; Airwars maintains live assessments and reported ranges. Missing death or injury values remain unmeasured.
Airwars minimum civilian deaths
- Population
- Civilians reported by Airwars in incident USYEM250419b
- Period
- 2025-04-19 to 2025-04-19
- Method
- Airwars incident minimum; fair civilian-harm evidence and likely/declared US attribution. Incident IDs deduplicate time and place. Excludes the three April 6, 17 and 28 incidents already represented by DoD observations. No operation count is added for this component of Rough Rider.
- Limitations
- Independent source assessment, not a US admission or legal finding. Local reporting may be incomplete; Airwars maintains live assessments and reported ranges. Missing death or injury values remain unmeasured.
Airwars minimum civilian deaths
- Population
- Civilians reported by Airwars in incident USYEM250426a
- Period
- 2025-04-26 to 2025-04-26
- Method
- Airwars incident minimum; fair civilian-harm evidence and likely/declared US attribution. Incident IDs deduplicate time and place. Excludes the three April 6, 17 and 28 incidents already represented by DoD observations. No operation count is added for this component of Rough Rider.
- Limitations
- Independent source assessment, not a US admission or legal finding. Local reporting may be incomplete; Airwars maintains live assessments and reported ranges. Missing death or injury values remain unmeasured.
Airwars minimum civilian deaths
- Population
- Civilians reported by Airwars in incident USYEM250427a
- Period
- 2025-04-27 to 2025-04-27
- Method
- Airwars incident minimum; fair civilian-harm evidence and likely/declared US attribution. Incident IDs deduplicate time and place. Excludes the three April 6, 17 and 28 incidents already represented by DoD observations. No operation count is added for this component of Rough Rider.
- Limitations
- Independent source assessment, not a US admission or legal finding. Local reporting may be incomplete; Airwars maintains live assessments and reported ranges. Missing death or injury values remain unmeasured.
Documented civilian deaths
- Population
- Civilians the Defense Department assessed as more likely than not killed in three confirmed Operation Rough Rider incidents
- Period
- 2025-04-06 to 2025-04-28
- Method
- Sum of the Defense Department's incident-level assessed civilian deaths for Sanaa, Ras Isa, and Sa'ada.
- Limitations
- Official assessed count for three incidents only; 15 additional incident reports remained under review and are excluded.
Conflict accountability
Attributed legal assessments, official civilian-harm inquiries, conflict-related pardons and ICC sanctions orders.
Political and foreign influence
Money or assets with a documented political, foreign-state, or foreign-policy connection.
Business and charity
Business revenue, public payments, court outcomes, and bankruptcy records tied to Trump-linked organizations.
Crypto exposure
Verified market, wallet, and proceeds measurements tied to Trump-linked tokens or ventures.